
Launch in Days, Not Weeks
Professional one-page website. Only a few slots left this month
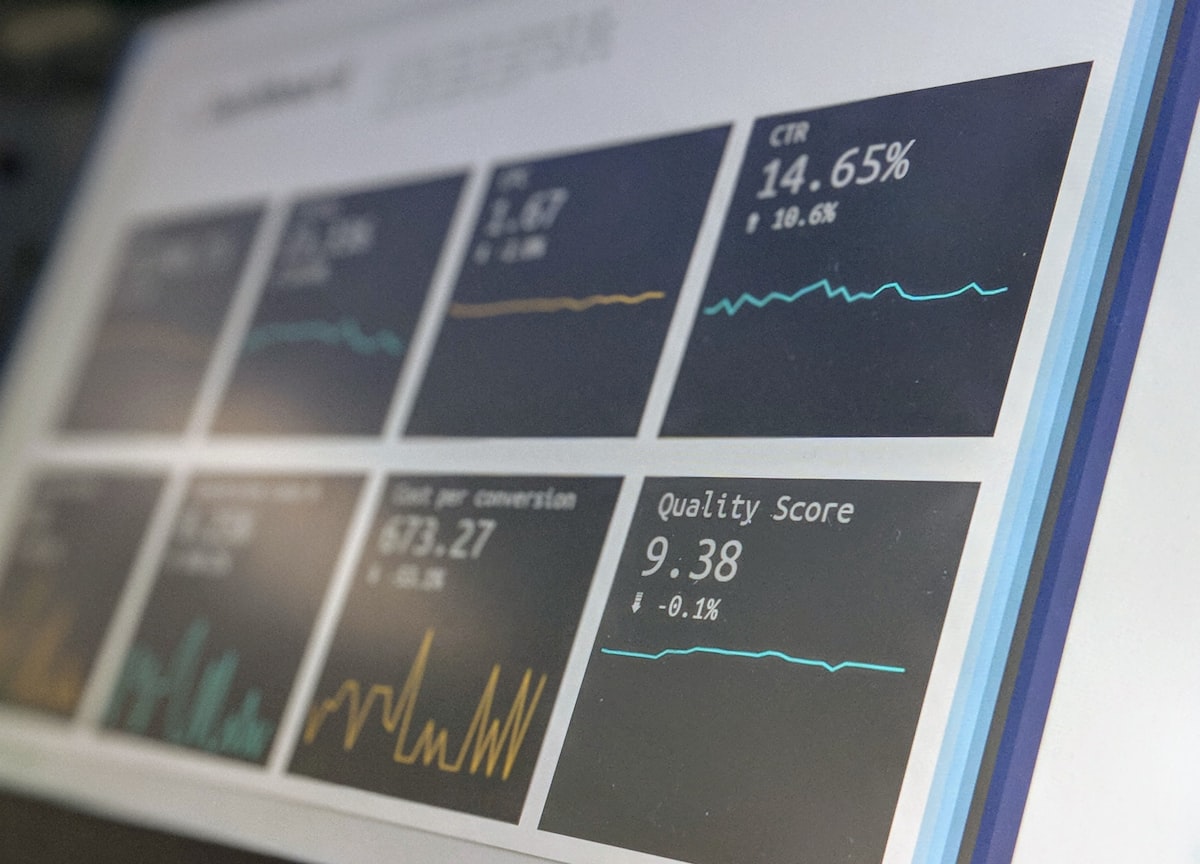
You have built the automations. They are running. But how do you know they are working correctly? The answer is not “wait until a client complains.” Here is how to set up monitoring that gives you confidence without requiring a DevOps team.
The instinct when setting up monitoring is to track everything. This leads to dashboard sprawl, alert fatigue, and the paradox of having comprehensive data that nobody actually reads.
Start with five metrics that matter:
Success rate. What percentage of workflow executions complete successfully? A healthy automation runs above 98%. Below 95% consistently means something structural is wrong, not just occasional noise.
Execution time. How long does each run take? Gradual drift upward often indicates a connected system slowing down, data volume growing, or an efficiency problem in your logic. Set a baseline and alert when execution time exceeds 2x baseline.
Error rate by type. Not just that errors are happening, but what kind. Authentication errors have different causes and fixes than data format errors. Pattern recognition in error types tells you where to focus.
Queue depth. For automations that process a queue of items, how deep is the queue right now compared to normal? A growing queue means the automation is processing slower than items are arriving, which will eventually cause delays.
Output quality. For AI-assisted automations specifically: are outputs hitting your quality threshold? A lead qualification agent with declining confidence scores needs prompt attention.
What to ignore: individual exception events that were handled by fallback, minor timing variations within normal bounds, informational logs that confirm expected behaviour. These fill dashboards without informing decisions.
You do not need enterprise observability tooling to monitor business automations effectively. For teams under 20 people, these approaches work well:
Daily email digest. Most automation platforms (n8n, Make, etc.) can send a daily summary: total executions, success rate, errors encountered. If you read one email per day about your automations, you will catch most problems within 24 hours.
Slack notifications for critical failures. Reserve real-time alerts for events that require immediate action. An automation handling time-sensitive business data that fails during business hours warrants a Slack message to the owner immediately. An automation processing overnight reports can wait for the morning digest.
Weekly review ritual. Set aside 15 minutes on a fixed day each week to look at your automation health. Check: did anything fail repeatedly this week? Are execution times drifting? Are error types changing? This simple rhythm catches slow-building problems before they become crises.
Exception logging in a shared document. For small teams, a shared document listing automation exceptions with dates and resolutions creates a light-weight audit trail. When the same error appears three times in a month, the log makes the pattern visible.
If your operation has grown to the point where a simple monitoring dashboard is warranted, these elements belong on it:
Status indicators. One traffic light per automation: green (running normally), yellow (elevated errors, investigate), red (failed or stopped). This gives you a 30-second health check.
Trend lines, not just snapshots. A success rate of 97% today is meaningful only in context. Is that up from 94% last week (improving) or down from 99% (degrading)? Trend lines show direction.
Volume metrics. How many tasks did each automation process today compared to a typical day? Unusual volume can indicate a data problem upstream or a downstream system being flooded.
Last successful run timestamp. For automations that should run on a schedule, knowing when they last ran successfully is crucial. An automation that was supposed to run at 2am and shows no activity is a problem even if it shows no errors.
Tools for building this: most platforms have native dashboards worth starting with. Cronitor and Better Uptime are specifically designed for monitoring scheduled jobs and automations with minimal setup. For more complex needs, Datadog or Grafana provide full observability at higher cost and complexity.
Reactive monitoring catches failures after they happen. Proactive monitoring catches degradation before it becomes failure.
Threshold alerts before failure. Do not alert only when success rate hits 0%. Alert when it drops below 95%. That gives you time to investigate before the automation fails completely.
Canary runs. For critical automations, run a test transaction through the full workflow on a schedule (daily or weekly). If the test fails, you know before any real data is affected.
Anomaly detection on timing. If an automation that normally runs in 30 seconds starts taking 90 seconds, something has changed. This might be benign (increased data volume) or a warning sign (a connected system is struggling). Catching this early gives you time to investigate calmly rather than react under pressure.
Downstream validation. For automations that write data somewhere, periodically sample the outputs and check they match expectations. A lead qualification agent that has been routing everything to the same sales rep for a week probably has a routing bug.
Fifteen minutes, same day every week, working through these questions:
Log your answers briefly. Over time, this log becomes a record of your automation health and the source of your maintenance decisions.
Building this rhythm early, before you have many automations, makes it sustainable when you have many. Trying to establish the habit when you have 20 automations breaking down simultaneously is much harder.
Our managed systems service includes monitoring setup, alert configuration, and ongoing health reviews for automations we deploy. If you would rather focus on your business than on watching dashboards, that is what managed operations is for.
Want managed monitoring for your automations? Get in touch or read our error handling guide for the resilience layer that monitoring depends on.